
The Inland California Distress Signal: A $39 Billion Problem
A composite ranking of financial distress across 100 U.S. cities places inland California at a significantly higher risk than its coastal counterparts – averaging a 39th-worst national ranking, translating to roughly $39 billion in potential economic friction across just six cities. This isn’t a story about California’s famed affordability solving all problems; it’s a data-driven illustration of how wage stagnation inland creates a persistent vulnerability, even where housing costs are lower. Jonathan Lansner’s analysis, based on a WalletHub ranking incorporating credit scores, late payments, bankruptcies, and debt-related online searches, reveals a geographic divide far more potent than simple cost-of-living calculations suggest.
See the original ocregister.com story for the full account.
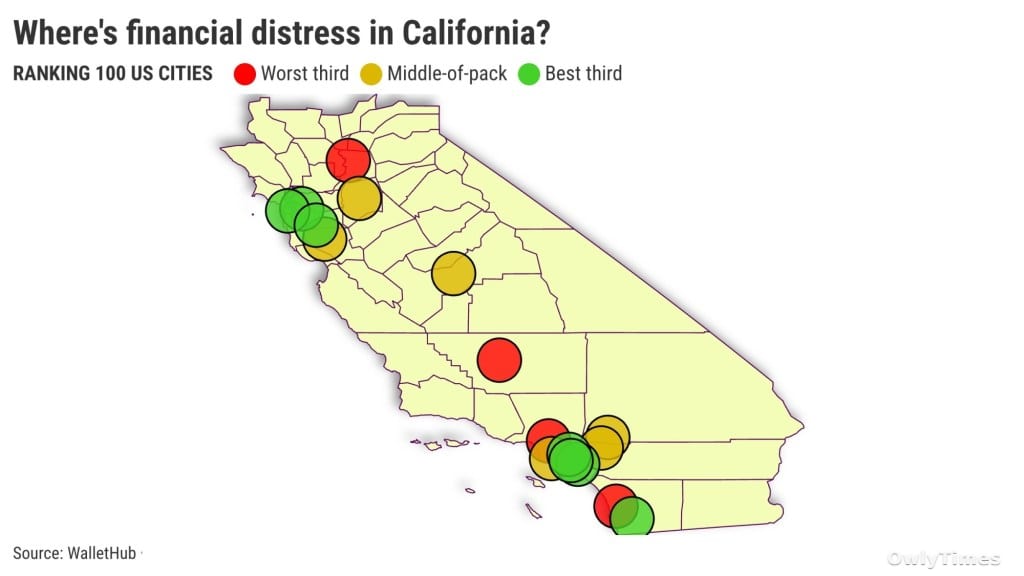
The headline figure – 39th – isn’t just a number; it represents a systemic weakness. To put this in perspective, the seven cities of Southern California averaged a 56th-worst ranking, while the four cities in the Bay Area clocked in at 69th. This 27-point gap between inland California and the Bay Area demonstrates a clear correlation between proximity to the Pacific Ocean and financial stability. Bakersfield leads the inland distress, landing at 24th nationally, followed closely by Sacramento (30th), San Bernardino (39th), Stockton (43rd), Fresno (45th), and Riverside (52nd). These aren’t isolated incidents; they’re interconnected points on a map of economic pressure.
Los Angeles: The Coastal Exception That Proves the Rule
While the inland cities bear the brunt of the financial distress, the data reveals a critical outlier: Los Angeles, ranked fifth-worst nationally. This seemingly contradicts the coastal stability narrative, but “Follow the money” reveals a different story. Los Angeles’s high ranking isn’t due to a lack of economic activity, but rather the sheer scale of its financial obligations and the concentration of vulnerable populations. The city’s $400+ billion economy generates significant debt, and a larger population inevitably means more bankruptcies and late payments, even with higher average incomes. This highlights a crucial distinction: distress isn’t solely about income levels, but also about the magnitude of financial risk within a given population center.
The contrast within Southern California is stark. While Los Angeles struggles at 5th, Irvine (70th) and Chula Vista (89th) demonstrate relative stability. This suggests that even within the same region, localized economic factors – industry concentration, employment rates, and housing market dynamics – play a significant role in determining financial health. San Diego’s 22nd-worst ranking further underscores this point; a major metropolitan area with a strong economy still faces substantial financial challenges.
The Anatomy of Inland Distress: Credit, Debt, and Online Signals
Digging into the WalletHub scorecard reveals the specific drivers of inland California’s financial woes. Credit scores are consistently lower inland, indicating a higher proportion of residents with damaged credit histories. Late payments are also more prevalent, suggesting a struggle to meet basic financial obligations. While bankruptcy filings are increasing across the state, the rate of growth is slowest in Southern California, indicating a degree of resilience. Perhaps most telling is the increased frequency of worrisome online searches for debt and loans inland – a clear signal of desperation and a proactive attempt to address financial shortfalls. These aren’t merely symptoms; they’re interconnected feedback loops, where poor credit leads to higher interest rates, which leads to more debt, and so on.
The data also reveals a geographic pattern in late payments. They are most difficult to find in Northern California, suggesting a stronger financial safety net in that region. This could be attributed to a combination of factors, including higher average incomes, more stable employment opportunities, and a greater prevalence of financial literacy programs. The varying rates of bankruptcy filings and online searches further reinforce the idea that inland California is facing a unique set of financial challenges.
What This Means for Your Wallet
The WalletHub data, averaging a 53rd-worst national rank across California’s 17 studied cities, isn’t just an academic exercise. For residents of inland California, this translates to higher borrowing costs, limited access to credit, and increased financial vulnerability. For investors, it signals potential risks in the housing market and a need for caution when evaluating businesses operating in these regions. The persistent wage gap between coastal and inland California is the underlying cause, and until that gap is addressed, these financial pressures will likely continue.
The key question now is whether state and local policies can effectively mitigate these risks. Will targeted financial literacy programs, job training initiatives, and affordable housing solutions be enough to offset the structural economic disadvantages faced by inland communities? Watch for changes in bankruptcy filing rates and credit score trends over the next 12-18 months – these will be the clearest indicators of whether the current trajectory is shifting, or if inland California’s financial distress is poised to worsen.